
Profit Scanner allow you to create custom screener and alert using formula. This article discusses how to write criteria for these features.
What is a Screener?
A screener is a tool that filters stocks and cryptos based on specific criteria. The criteria are expressed in mathematical formulas known as Boolean Expressions. These expressions evaluate to either true or false.
Examples:
-
4 == 4→ true -
4 == 3 + 1→ true -
4 > 5→ false -
true and false→ false -
true or false→ true
The screener processes these expressions against all listed stocks and displays those that evaluate to true.
Expression Hierarchy
Expressions can be categorized as:
-
Boolean Expressions (BE): Evaluates to true or false.
-
Arithmetic Expressions (AE): Evaluates to a numeric value.
-
Stock Expressions: Combines stock attributes and functions.
Operators include:
-
Boolean Operations:
and,or,not -
Arithmetic Comparisons:
>=,<=,>,<,==,!= -
Arithmetic Operations:
*,/,+,-
Stock Expressions
Stock Expressions are combinations of stock attributes and functions. They can include:
-
Candle Selectors:
prev,current, etc. -
Timeframes:
daily,weekly,hourly, etc. -
Stock Attributes:
open,close,volume,macd,rsi, etc. -
Stock Functions:
sma(n),ema(n),macd(fast, slow), etc.
Example:
d close > d sma(20) AND d sma(20) > d sma(50)
This expression filters stocks where:
-
The current day’s close is above the 20-day simple moving average.
-
The 20-day SMA is above the 50-day SMA.
Fundamental Attributes
You can also filter stocks based on fundamental attributes such as:
-
roe > 12(Return on Equity) -
market_cap > 10T(Market Capitalization) -
debt_equity < 1(Debt to Equity Ratio)
Example:
roe > 12 AND market_cap > 10T AND debt_equity < 1
This expression filters stocks with:
-
A Return on Equity greater than 12%.
-
A market capitalization greater than 10 trillion.
-
A debt to equity ratio less than 1.
Screener
Boolean Expression and Arithmetic Expression are derivatives of Expression. An Arithmetic Expression is an expression/statement that produces a single value within the set of real numbers. An Expression itself is defined as “anything that produces a single value.”
The hierarchy of Expression is as follows:
Expression:
– Boolean Expression (BE)
– Boolean Value: true, false
– Bracket Expression: ( BE )
– Boolean Operation: and, or, not
– Arithmetic Comparison: >=, <=, >, <, ==, !=
– Arithmetic Expression (E)
– Numeric Expression
– Arithmetic Operation: *, /, +, –
– Bracket Expression: ( E )
– Stock Expression
(Note: in this document and in our criteria composer, we use the notation E as an abbreviation for Arithmetic Expression.)
Part that is quite important in screener formula is Stock Expression, which is derivative of Arithmetic Expression.
Structure of Stock Expression is as follow:
E: stock_expression: [candle_selector] [timeframe] [target] <stock_attr>

E: stock_expression: [candle_selector] [timeframe] [target] <stock_function>

E: stock_expression: <stock_fundamental_attr>

E: stock_expression: <bid_offer_variables>
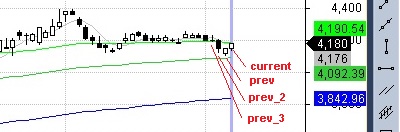
candle_selector: prev_N, ..., prev_3, prev_2, prev, current

default: current
Candle Selector
timeframe: yearly, quarterly, monthly, weekly, daily, hourly, 15min, 5min, 1min

default: daily
target: stock, sector, index

default: stock
stock_attr:

open, high, low, close, volume

macd, macd_signal, macd_histogram

rsi, stoch_k, stoch_d, stochrsi, atr, adx, pdx, ndx, cci, uo, roc, william_r, mfi

alligator_jaw, alligator_teeth, alligator_lips, alligator_ao, alligator_ac

bollinger_top, bollinger_bottom, bollinger_mean, bollinger_bandwidth, bollinger_percent_b, bollinger_percent_b_avg

value, top_broker, foreign, top_broker_hist, foreign_hist

dto_stochk, dto_stochd, obv, sar

pivot_s1, pivot_s2, pivot_s3, pivot_r1, pivot_r2, pivot_r3

mid_price, tick
stock_function:

sma(n), sma(subformula,n)

ema(n), ema(subformula,n)

highest(subformula,n), hhv(subformula,n)

lowest(subformula,n), llv(subformula,n)

ranking(subformula,n)

ranking_per_sector(subformula,n)

roc(n)

macd(fast_period,slow_period)

macd_signal(fast_period,slow_period,signal_period)

macd_histogram(fast_period,slow_period,signal_period)

sum(subformula,n)

vwap(n)

cci(n)

atr(n)

adx(n)

pdx(n)

ndx(n)

stoch_k(lookback_period,k_period)

stoch_d(lookback_period,k_period,d_period)

bollinger_top(period, multiplier)

bollinger_bottom(period, multiplier)

bollinger_mean(period, multiplier)

bollinger_bandwidth(period, multiplier)

bollinger_percent_b(period, multiplier)

bollinger_percent_b_avg(period, multiplier)

rsi(n)

stochrsi(period,dtostoch_period,dtostoch_k_period,dtostoch_d_period)

dto_stochk(period,dtostoch_period,dtostoch_k_period,dtostoch_d_period)

dto_stochd(period,dtostoch_period,dtostoch_k_period,dtostoch_d_period)
Parameters that has default values can be omitted. In case of Stock Expression , only stock_attr is mandatory.
Examples:
current daily stock close == close                ==> true

current daily stock close == daily close          ==> true

current daily stock close == stock close          ==> true

current daily stock close == current daily close  ==> true
But when a non-mandatory parameter is specified, the position is important and have to be written according to the above mentioned structure.
Examples:
stock daily close    ==> error

daily current close  ==> error

current daily close  ==> OK
The target parameter can have 3 values, that is: stock, sector, index
stock : define the target valuation of stock_attr is the stock chart itself, this is the default value and can be omitted.
sector : define the target valuation of stock_attr is the stock sector chart.
index : define the target valuation of stock_attr is the stock index chart
Below is the translation of the provided definition of stock_attr :
open, high, low, close, volume : Values of open, high, low, close, and volume from the stock candlestick chart.
macd, macd_signal, macd_histogram : Values from the MACD(12,26,9) chart, where `macd_histogram = macd – macd_signal`.
rsi : Value from the RSI(14) chart.
stoch_k, stoch_d : Values from the Stochastic(15,3,3) chart.
stochrsi : Value from the StochRSI(9,6) chart.
atr : Value from the ATR(14) chart.
adx, pdx, ndx : Values from the ADX(14) chart.
cci : Value from the CCI(14) chart.
uo : Value from the UO(7,14,28) chart.
roc : Value from the ROC(12) chart.
william_r : Value from the WilliamsR(14) chart.
mfi : Value from the MFI(14) chart.
alligator_jaw, alligator_teeth, alligator_lips, alligator_ao, alligator_ac : Values from the Alligator(13,8,5) chart.
bollinger_top, bollinger_bottom, bollinger_mean, bollinger_bandwidth, bollinger_percent_b, bollinger_percent_b_avg : Values from the Bollinger(20,2) chart.
value : Total value of stock transactions.
dto_stochk, dto_stochd : Values from the DTOStoch(8,5,3) chart.
obv : Values from the On-Balance Volume chart.
sar : Value from the SAR(0.02,0.2) chart.
pivot_s1, pivot_s2, pivot_s3, pivot_r1, pivot_r2, pivot_r3 : Pivot support and resistance levels.
mid_price : mid_price = (high + low) / 2
vwap : vwap = (high + low + close) / 3
stock_function is part of stock_attr, below is the definition of stock_function:
sma("<stock_attr>",N) : simple moving average of stock_attr with N candles
Example:
sma("close", 5) ==> MA5 value of stock daily chart close price
hourly sma("volume", 20) ==> MA20 value of stock hourly chart volume
ema("<stock_attr>",N) : exponential moving average of stock_attr with N candles
Example:
ema("close", 5) ==> EMA5 value of stock daily chart close price
hourly ema("volume", 20) ==> EMA20 value of stock hourly chart volume
highest("<stock_attr>",N) :
hhv("<stock_attr>",N) : highest value of stock_attr with N candles
Example:
daily hhv("high", 5) ==> 5 day highest high daily
hourly hhv("close", 5) ==> 5 hour highest close hourly
lowest("<stock_attr>",N) :
llv("<stock_attr>",N) : lowest value of stock_attr with N candles
Example:
daily llv("low", 5) ==> 5 day lowest low daily
hourly llv("close", 5) ==> 5 hour lowest close hourly
roc(period) : value of Rate of Change (ROC)
Example:
roc(12) ==> value of roc(12)
macd(fast_period,slow_period) :
macd_signal(fast_period,slow_period,signal_period) :
macd_histogram(fast_period,slow_period,signal_period) : value of macd, macd_signal, and macd_histogram
Example:
macd(12, 26) ==> value of macd(12, 26)
macd_signal(12, 26, 9) ==> value of macd signal(12, 26, 9)
macd_histogram(12, 26, 9) ==> value of macd histogram(12, 26, 9)
sum("<stock_attr>",N) : sum of stock_attr with N candles
Example:
sum("volume", 5) ==> sum of volume in 5 candles of daily chart
vwap(N) : value of Volume-Weighted Average Price (VWAP)
Formula:
vwap(N) = sum("volume * (high + low + close) / 3", N) / sum("volume", N)
Example:
vwap(5) value of vwap with 5 candle period
atr(period) : value of Average True Range (ATR)
Example: ==> value of atr(14)
atr(14)
adx(period) : value of Average Directional Index (ADX)
Example: ==> value of adx(14)
adx(14)
pdx(14) ==> value of DI+ in adx(14) indicator
ndx(14) ==> value of DI- in adx(14) indicator
cci(period) : value of Commodity Channel Index (CCI)
Example: ==> value of cci(20)
cci(20)
stoch_k(lookback_period,k_period) :
stoch_d(lookback_period,k_period,d_period) : value of Stochastic Oscillator
Example: ==> value of Stochastic %K(15, 3)
stock_k(15, 3)
stock_d(15, 3, 3) ==> value of Stochastic %D(15, 3, 3)
bollinger_top(period, multiplier) :

bollinger_bottom(period, multiplier) :

bollinger_mean(period, multiplier) :

bollinger_bandwidth(period, multiplier) :

bollinger_percent_b(period, multiplier) :

bollinger_percent_b_avg(period, multiplier) : value of Bollinger Bands

Example:

bollinger_top(20, 2) ==> value of Bollinger Band top line(20, 2)

bollinger_bottom(20, 2) ==> value of Bollinger Band bottom line(20, 2)
rsi(n) : value of Relative Strength Index (RSI)
Example:
rsi(14) ==> value of rsi(14)
stochrsi(period,dtostoch_period,dtostoch_k_period,dtostoch_d_period)
dto_stochk(period,dtostoch_period,dtostoch_k_period,dtostoch_d_period)
dto_stochd(period,dtostoch_period,dtostoch_k_period,dtostoch_d_period) : value of StochRSI
Example:
stochrsi(14, 8, 5, 3) ==> value of stochrsi(14, 8, 5, 3)
dto_stochk(14, 8, 5, 3) ==> value of %K in stochrsi(14, 8, 5, 3)
dto_stochd(14, 8, 5, 3) ==> value of %D in stochrsi(14, 8, 5, 3)
stock_fundamental_attr:

debt_equity, ebitda, ebitda_anl, eps, eps_anl

ev_ebitda, ev_ebitda_anl, market_cap, netprofit, netprofit_anl

pbv, pbv_anl, per, per_anl, revenue, revenue_anl

roa, roa_anl, roe, roe_anl
debt_equity : Debt to Equity Ratio
ebitda : Earnings Before Interest, Taxes, Depreciation and Amortization (latest financial report)
ebitda_anl : Earnings Before Interest, Taxes, Depreciation and Amortization (annualized)
eps : Earning Per Share (latest financial report)
eps_anl : Earning Per Share (annualized)
ev_ebitda : Enterprise Multiple (latest financial report)
ev_ebitda_anl : Enterprise Multiple (annualized)
market_cap : Market Capitalization
netprofit : Net Profit (latest financial report)
netprofit_anl : Net Profit (annualized)
pbv : Price-to-Book Ratio (latest financial report)
pbv_anl : Price-to-Book Ratio (annualized)
per : Price-Earnings Ratio (latest financial report)
per_anl : Price-Earnings Ratio (annualized)
revenue : Revenue (latest financial report)
revenue_anl : Revenue (annualized)
roa : Return on assets (latest financial report)
roa_anl : Return on assets (annualized)
roe : Return on Equity (latest financial report)
roe_anl : Return on Equity (annualized)
Some examples of screener formula:
– higher high higher low :
prev high < high and prev low < low
– inside bar :
prev high > high and prev low < low
– golden cross MA 5-20 (MA5 line cross up MA20) :
prev sma(5) < prev sma(20) and sma(5) > sma(20)
– MACD going up :
prev macd < macd and macd > 0
– three white soldier :
prev_2 close > prev_2 open

and prev close > prev open

and close > open